TL;DR:
- Dispensaries should track both visibility and outcome metrics to measure true SEO success.
- Google Search Console, Google Business Profile, and GA4 provide essential, complementary data on search performance and local actions.
- Regularly analyzing aggregated, period-over-period data helps dispensaries make informed, strategic SEO adjustments.
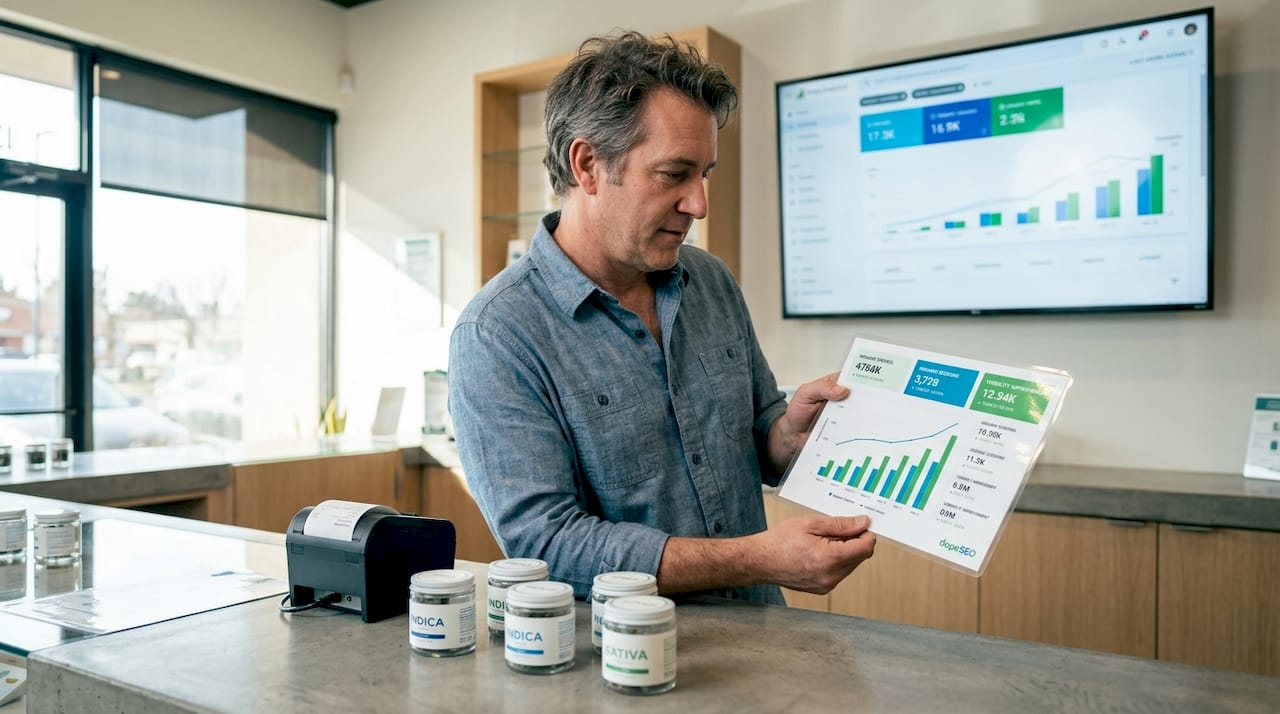
You put real time and money into SEO for your dispensary, but when someone asks “is it working?”, you hesitate. That hesitation is more common than you think. Most dispensary owners can see their website traffic in a general sense, but linking those numbers to actual foot traffic, phone calls, or product sales feels murky at best. The good news is that proven, dispensary-specific tracking methods exist today, and once you set them up correctly, you’ll know exactly where your growth is coming from and what to do next.
| Point | Details |
|---|---|
| Track full funnel metrics | Monitor both visibility (ranking, impressions) and outcomes (conversions, leads) to get the real ROI of your SEO. |
| Separate website and local SEO | Distinguish Google Business Profile actions from website results to sharpen strategy and budget allocation. |
| Switch to weekly/monthly views | Weekly and monthly data make it easier to spot true performance trends and avoid reacting to daily noise. |
| Tie keywords to conversions | Connect search queries to actual sales or leads for smarter content and campaign decisions. |
Before you open a single analytics dashboard, you need a clear picture of what success actually looks like for your dispensary. More website visits? Higher-quality leads from locals ready to buy? Direct revenue tied to organic search? The answer shapes every metric you track.
SEO metrics generally fall into two buckets:
Both types matter, but they serve different purposes. Visibility metrics act as early warning signals. If your impressions drop sharply in a given week, something changed before your sales do. Outcome metrics confirm whether your SEO effort is generating real business value. Track SEO progress by building a metric stack that connects visibility data (impressions, rank, CTR) directly to outcomes like engaged sessions, leads, and revenue.
A common pitfall for dispensaries is focusing exclusively on vanity metrics. Rankings feel satisfying to report, but a dispensary ranking number one for a low-intent keyword that never converts is essentially invisible to your bottom line. Tracking improving cannabis brand visibility alongside your conversion data closes that gap.
Pro Tip: Start with your business goals and work backwards. If your goal is increasing in-store visits, then direction requests, local keyword rankings, and call volume are your primary metrics. Build your tracking around those first.
Once you’ve established your goals and metrics stack, the best place to start monitoring real progress is your Google Search Console (GSC) dashboard. It’s free, it pulls directly from Google’s own data, and it shows you exactly how your dispensary’s pages perform in organic search.
Focus on the Performance report, which gives you four core data points: impressions, clicks, average position, and CTR. Here’s how to use each one meaningfully:
“Google Search Console is the source of truth for organic search visibility and click behavior — no other tool pulls directly from Google’s index the way GSC does.” GSC Performance data
Use the page filter to drill into individual location pages or product category pages. If your “indica flower” page is pulling strong impressions but low clicks, that’s a content or metadata problem you can fix quickly. For more actionable ideas, browse our SEO tips for dispensaries to see what specific content strategies perform best.
Pro Tip: Filter your GSC Performance report by individual pages to examine each location or product category independently. A dispensary with two or three locations should analyze each page separately rather than aggregating all data into one view.
While Search Console offers abundant data, not all of it is immediately actionable. Refining your timeframes helps you see the signal through the noise.
Daily SEO data is inherently noisy. Traffic on Mondays often looks very different from traffic on Saturdays. A cannabis dispensary might see a sharp spike on a particular day because of a local event, a competitor’s temporary closure, or a news cycle. If you’re checking daily numbers and reacting to every dip, you’ll waste time chasing ghosts.
Switching to weekly or monthly aggregation smooths out those daily fluctuations and makes real trends far easier to identify. Google introduced this time aggregation feature specifically to help site owners compare performance periods more cleanly.
Here’s an example of how the same data looks across three views:
| Time frame | Impressions | Clicks | CTR |
|---|---|---|---|
| Monday (daily) | 410 | 28 | 6.8% |
| Tuesday (daily) | 290 | 19 | 6.6% |
| Week 1 (weekly) | 2,350 | 162 | 6.9% |
| Week 2 (weekly) | 2,510 | 181 | 7.2% |
| January (monthly) | 9,870 | 715 | 7.2% |
| February (monthly) | 10,640 | 798 | 7.5% |
The daily view creates anxiety. The weekly and monthly views show a clear upward trend. For dispensary owners making strategic decisions, monthly comparisons are especially useful for spotting seasonal patterns, like increased interest in edibles around the holidays or topicals in summer.
Avoiding knee-jerk reactions to short-term dips protects your SEO strategy from unnecessary overhauls. If impressions drop for three days after you update a page, that’s normal. If impressions drop for four consecutive weeks, that’s worth investigating.
Online visibility is only half the battle for dispensaries. All local actions and leads matter. Here’s how to track what happens off your main website.
Your Google Business Profile (GBP) functions as a digital storefront in local search results and Google Maps. When someone searches “dispensary near me” and taps on your listing to call you or get directions, that action never touches your website. Without separate GBP tracking, you’d miss those conversions entirely.
Track GBP performance by monitoring these key actions in your GBP dashboard:
Here’s a side-by-side look at how GBP metrics compare to website analytics:
| Metric type | Source | What it measures |
|---|---|---|
| Organic sessions | GA4 (website) | Users arriving from Google search |
| GBP website clicks | Google Business Profile | Users clicking from your listing to your site |
| Direction requests | Google Business Profile | Intent to visit in person |
| Phone calls | Google Business Profile | Direct contact from local search |
| Page views | GA4 (website) | On-site content engagement |
| Goal completions | GA4 (website) | Forms, purchases, sign-ups |
Understanding the Google Business Profile benefits for local dispensary discovery is critical for any location-based business competing in a dense market.
Pro Tip: Add UTM parameters to the website URL in your GBP profile (for example, "?utm_source=google&utm_medium=gbp&utm_campaign=local`) so GA4 can attribute website sessions that originated from your GBP listing. Pair this with a call tracking number to capture phone conversions as well.
Now that you’re measuring visibility and local actions, it’s time to prove how SEO drives real business impact by linking user behavior to conversions.
Google Analytics 4 (GA4) is the tool that closes this loop. Setting up conversion tracking in GA4 lets you see not just how many users visited your site, but what those users did — and whether they came from organic search or your GBP listing.
Here are the essential conversion events every dispensary should track in GA4:
Many dispensary sales happen over the counter or by phone, which means not every conversion leaves a digital footprint. That’s why linking your GBP listing to GA4 via UTM parameters matters so much. GBP-to-site attribution typically requires UTM parameters on your GBP website URL and optional call tracking for offline conversions.
Pro Tip: In GA4, use the “Acquisition” report filtered by organic search to see which landing pages generate the most conversions. Then cross-reference those pages with your GSC Performance data to identify which specific search queries are driving your highest-value actions, not just your highest traffic.
With a variety of methods in your toolkit, here’s a quick guide to choosing the right combination for your dispensary’s needs.
Each tracking method serves a distinct purpose. Search Console, GBP, and GA4 each cover a different layer of your SEO performance, and using them together gives you the clearest picture.
| Method | Key metric | Best for | Resource level |
|---|---|---|---|
| Google Search Console | Impressions, clicks, average position | Tracking organic search visibility | Low (free, minimal setup) |
| Google Business Profile | Direction requests, calls, profile views | Local engagement and foot traffic | Low (free, built-in dashboard) |
| GA4 | Sessions, conversions, revenue | Behavior and conversion attribution | Medium (requires event setup) |
| UTM parameters | Channel-specific sessions | Cross-channel attribution | Low to medium |
| Call tracking | Phone leads by channel | Offline conversion tracking | Medium (third-party tool) |
Prioritize each method based on where your dispensary stands:
No single method tells the whole story. A dispensary that only checks GSC might celebrate growing impressions while missing the fact that GBP calls dropped by 30%. Using these tools together prevents blind spots.
Here’s something we see consistently: dispensaries invest in SEO, set up Google Search Console, and then spend months focused almost entirely on website traffic. When traffic plateaus, they assume SEO isn’t working. But the actual growth was happening in their GBP the entire time — direction requests up 40%, calls up 25% — and they never looked.
The disconnect between website data and local data is the most common and costly mistake in dispensary SEO. Most reporting tools default to website-centric views, which means GBP performance sits in a separate dashboard that rarely gets reviewed. When strategy decisions are made based on incomplete data, the wrong things get optimized.
The second big miss is ignoring period-over-period comparisons. Looking at this month’s numbers in isolation tells you very little. Comparing this January to last January, or this quarter to last quarter, reveals whether your SEO investment is compounding over time. That comparison is what separates dispensaries that make confident decisions from those that are constantly questioning whether SEO is “worth it.”
“Growth comes from clarity, not just more data.”
Our cannabis SEO case studies consistently show that the fastest-growing dispensaries aren’t necessarily the ones with the most sophisticated tools. They’re the ones reviewing the right metrics on a consistent schedule and making small, informed adjustments every month. Automation helps. Set up a simple monthly report that pulls your GSC trends, GBP action totals, and GA4 conversions into one place. Reviewing it monthly rather than quarterly keeps you responsive without being reactive.
Pro Tip: Automate your tracking reports using Google Looker Studio (formerly Data Studio) to pull GSC, GA4, and GBP data into a single dashboard. Set a recurring calendar reminder to review it on the first Monday of every month.
If tracking and acting on these methods feels overwhelming, you don’t have to learn it all alone. Setting up GA4 events, configuring UTM parameters, interpreting GSC trends, and keeping up with GBP changes is a lot to manage while also running a dispensary.
At Dope SEO, we handle the full tracking setup, analytics configuration, and ongoing optimization for cannabis dispensaries, so you always know what’s working and where to invest next. Our team understands the platform restrictions and regulatory nuances that make cannabis marketing different from every other industry. Whether you’re starting fresh or refining an existing strategy, our cannabis SEO guide is a strong next step, and our proven SEO strategies are built specifically for the competitive dispensary market. Book a call with our team and let’s map out a tracking and growth plan built around your goals.
Check your Search Console Performance report weekly for increases in impressions, clicks, and average position for your target keywords, since these are the earliest indicators of organic growth.
Track GBP performance metrics like calls, direction requests, and website clicks directly in your Google Business Profile dashboard, keeping them separate from your website analytics for a cleaner view of local engagement.
Daily data fluctuations are driven by day-of-week patterns, seasonal events, and other short-term factors, so switching to weekly or monthly views gives you a much clearer picture of whether your overall trajectory is improving.
Connect your GSC keyword data with GA4 conversion tracking so you can tie visibility to revenue by identifying which specific queries lead to your highest-value actions, such as product purchases, phone calls, or form completions.
© 2026 Curious Monkeys Pressing Buttons LLC DBA Cannabiz Marketing Solutions AKA DopeSEO. All rights reserved.